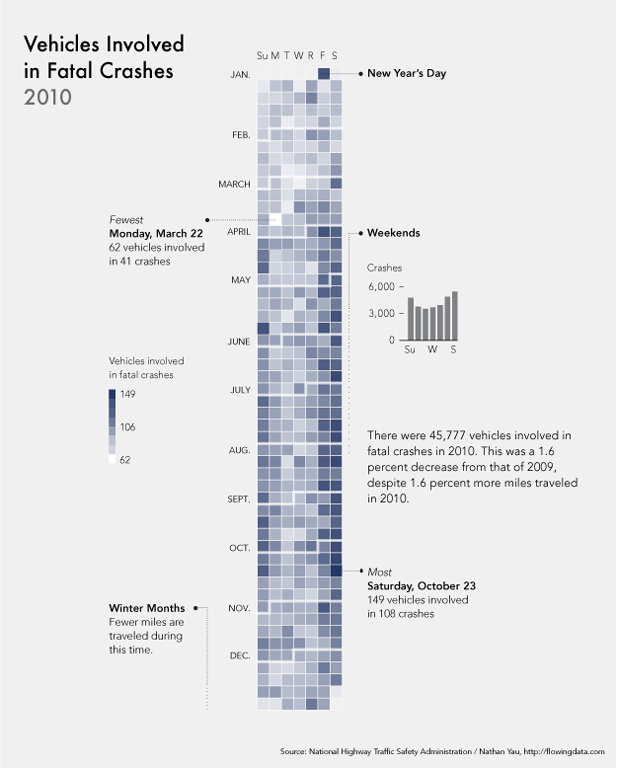
A very somber infographic for today. The number of vehicles in fatal car crashes in 2010 broken down by month, time of week, highest, fewest and totals for the year. Find out which month is the most dangerous.
A very somber infographic for today. The number of vehicles in fatal car crashes in 2010 broken down by month, time of week, highest, fewest and totals for the year. Find out which month is the most dangerous.